
Near-infrared imaging and lock-in thermography provide detailed, complementary information for studying the performance of PV modules. In previous work, we described how to extract both local efficiency and nonuniformity characteristics from high-resolution images (as low as 22 μm/pixel). Near-infrared images show electroluminescence from the absorber layer which serves as a proxy for local photovoltage, whereas infrared images show local power dissipation which serves as a proxy for source of power loss under operations.
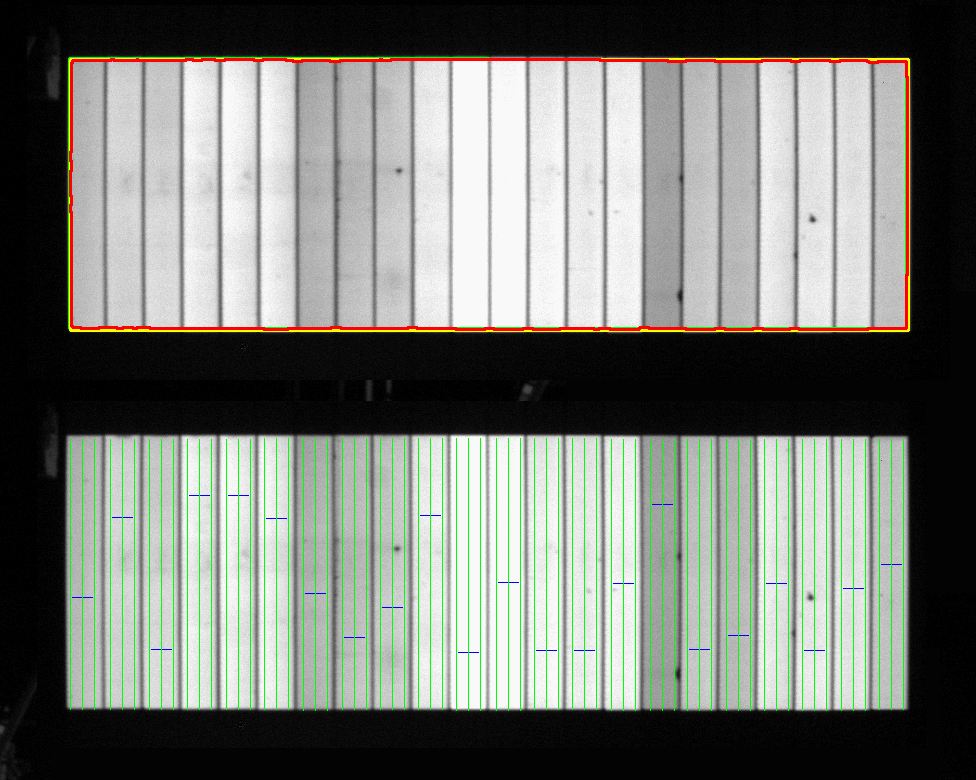
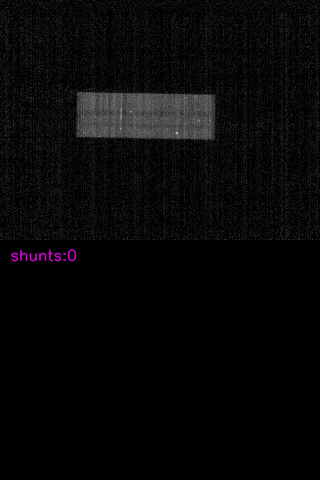

The images above show nominal behavior of thin film modules under forward and reverse bias. In forward bias, the near-infrared image of show good electroluminescence signal and consistent uniformity. In forward bias, the lock-in thermography image shows uniform power dissipation. In reverse bias, the lock-in thermography shows the point-sources of power dissipation at the protective bypass diodes.
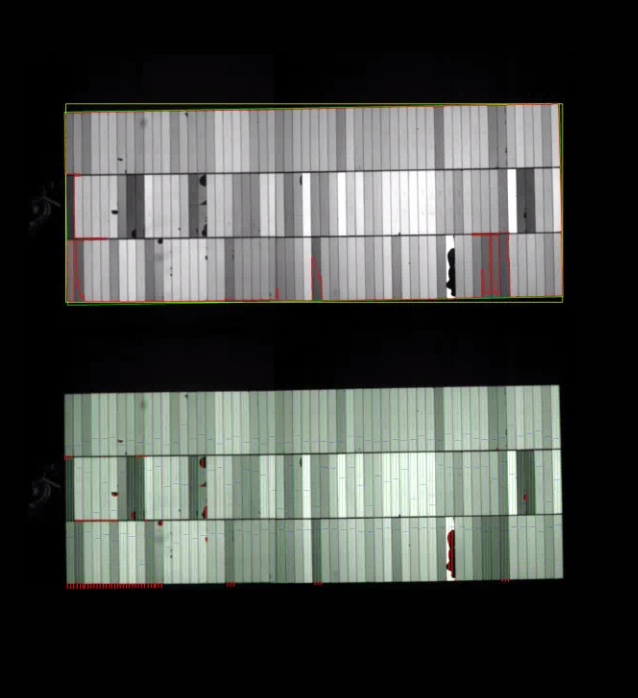


Not all modules show nominal behavior! Here are two images showing critical PV module quality issues. The left image shows delamination features based on regions of very low near-infrared emission, and the right image show shunting features based on parasitic, point sources of power dissipation.
